
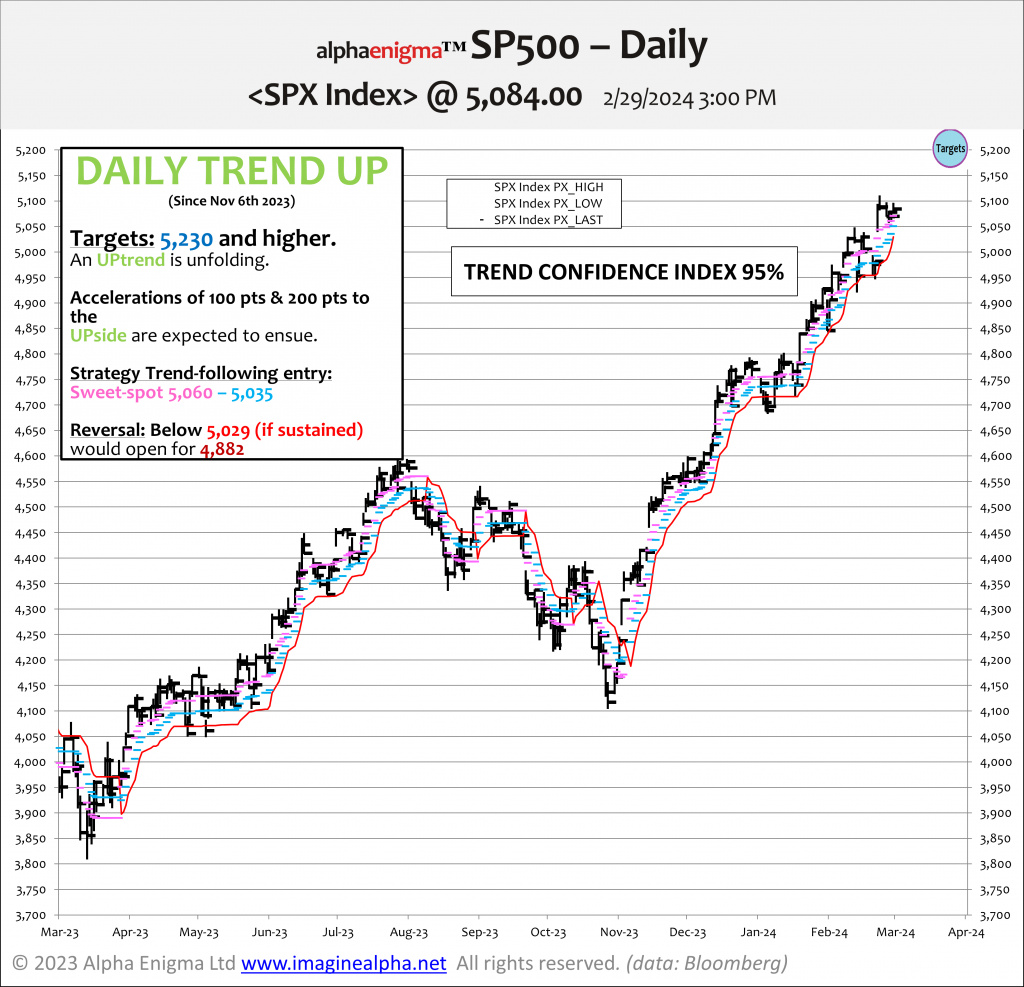
Keeping the UPtrend alive will require holding above 5,000…
The SP500 is ending the month anear the highs of the month. On the basis of the observed momentum it is on course to extend gains towards 5,200 and above.
As always and despite the 95% confidence score of this UPtrend, we do offer an alternative scenario, carrying a 5% probability. It hinges on a sustained move below 5,030 which would signal a corrective phase toward the 4,800.
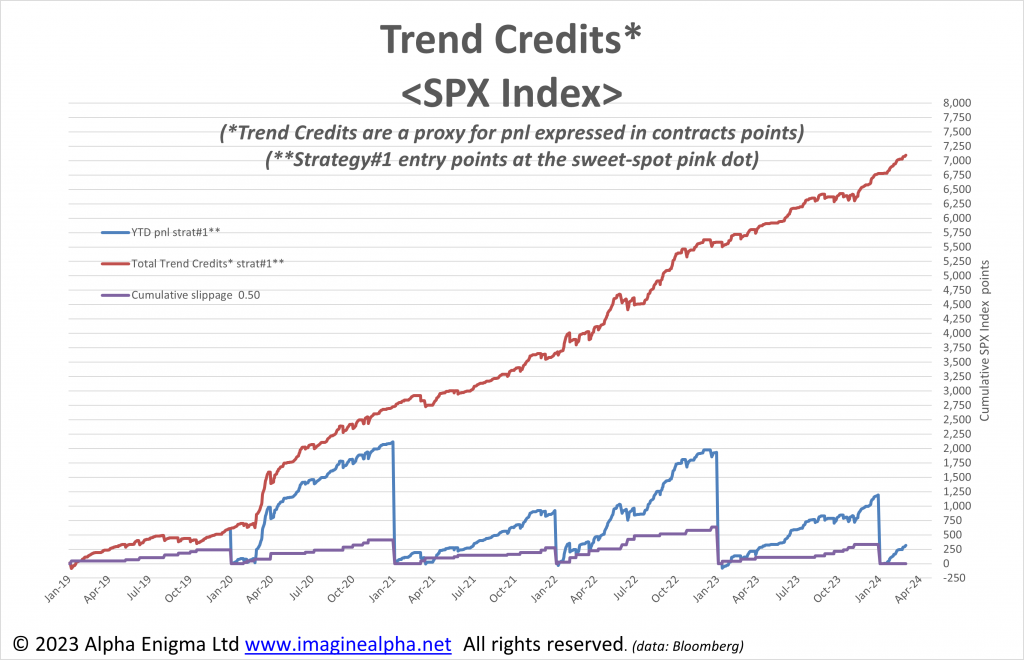
Tactical signals have been “equity accretive” since 2019.
The graph below shows the propensity of the SP500 to trend, both UP and DOWN. The exhibit below is not a firm back testing exercise, hence the use of the term Trend Credits to account for the accumulated amount of contracts points over the entire lookback window. Nevertheless, following trends around the sweet-spot (pink dot) would enable to limit drawdowns and increase the risk/reward profile.
For further details please contact carlos@imaginealpha-blog.com