
Bitcoin Tactical timeframe
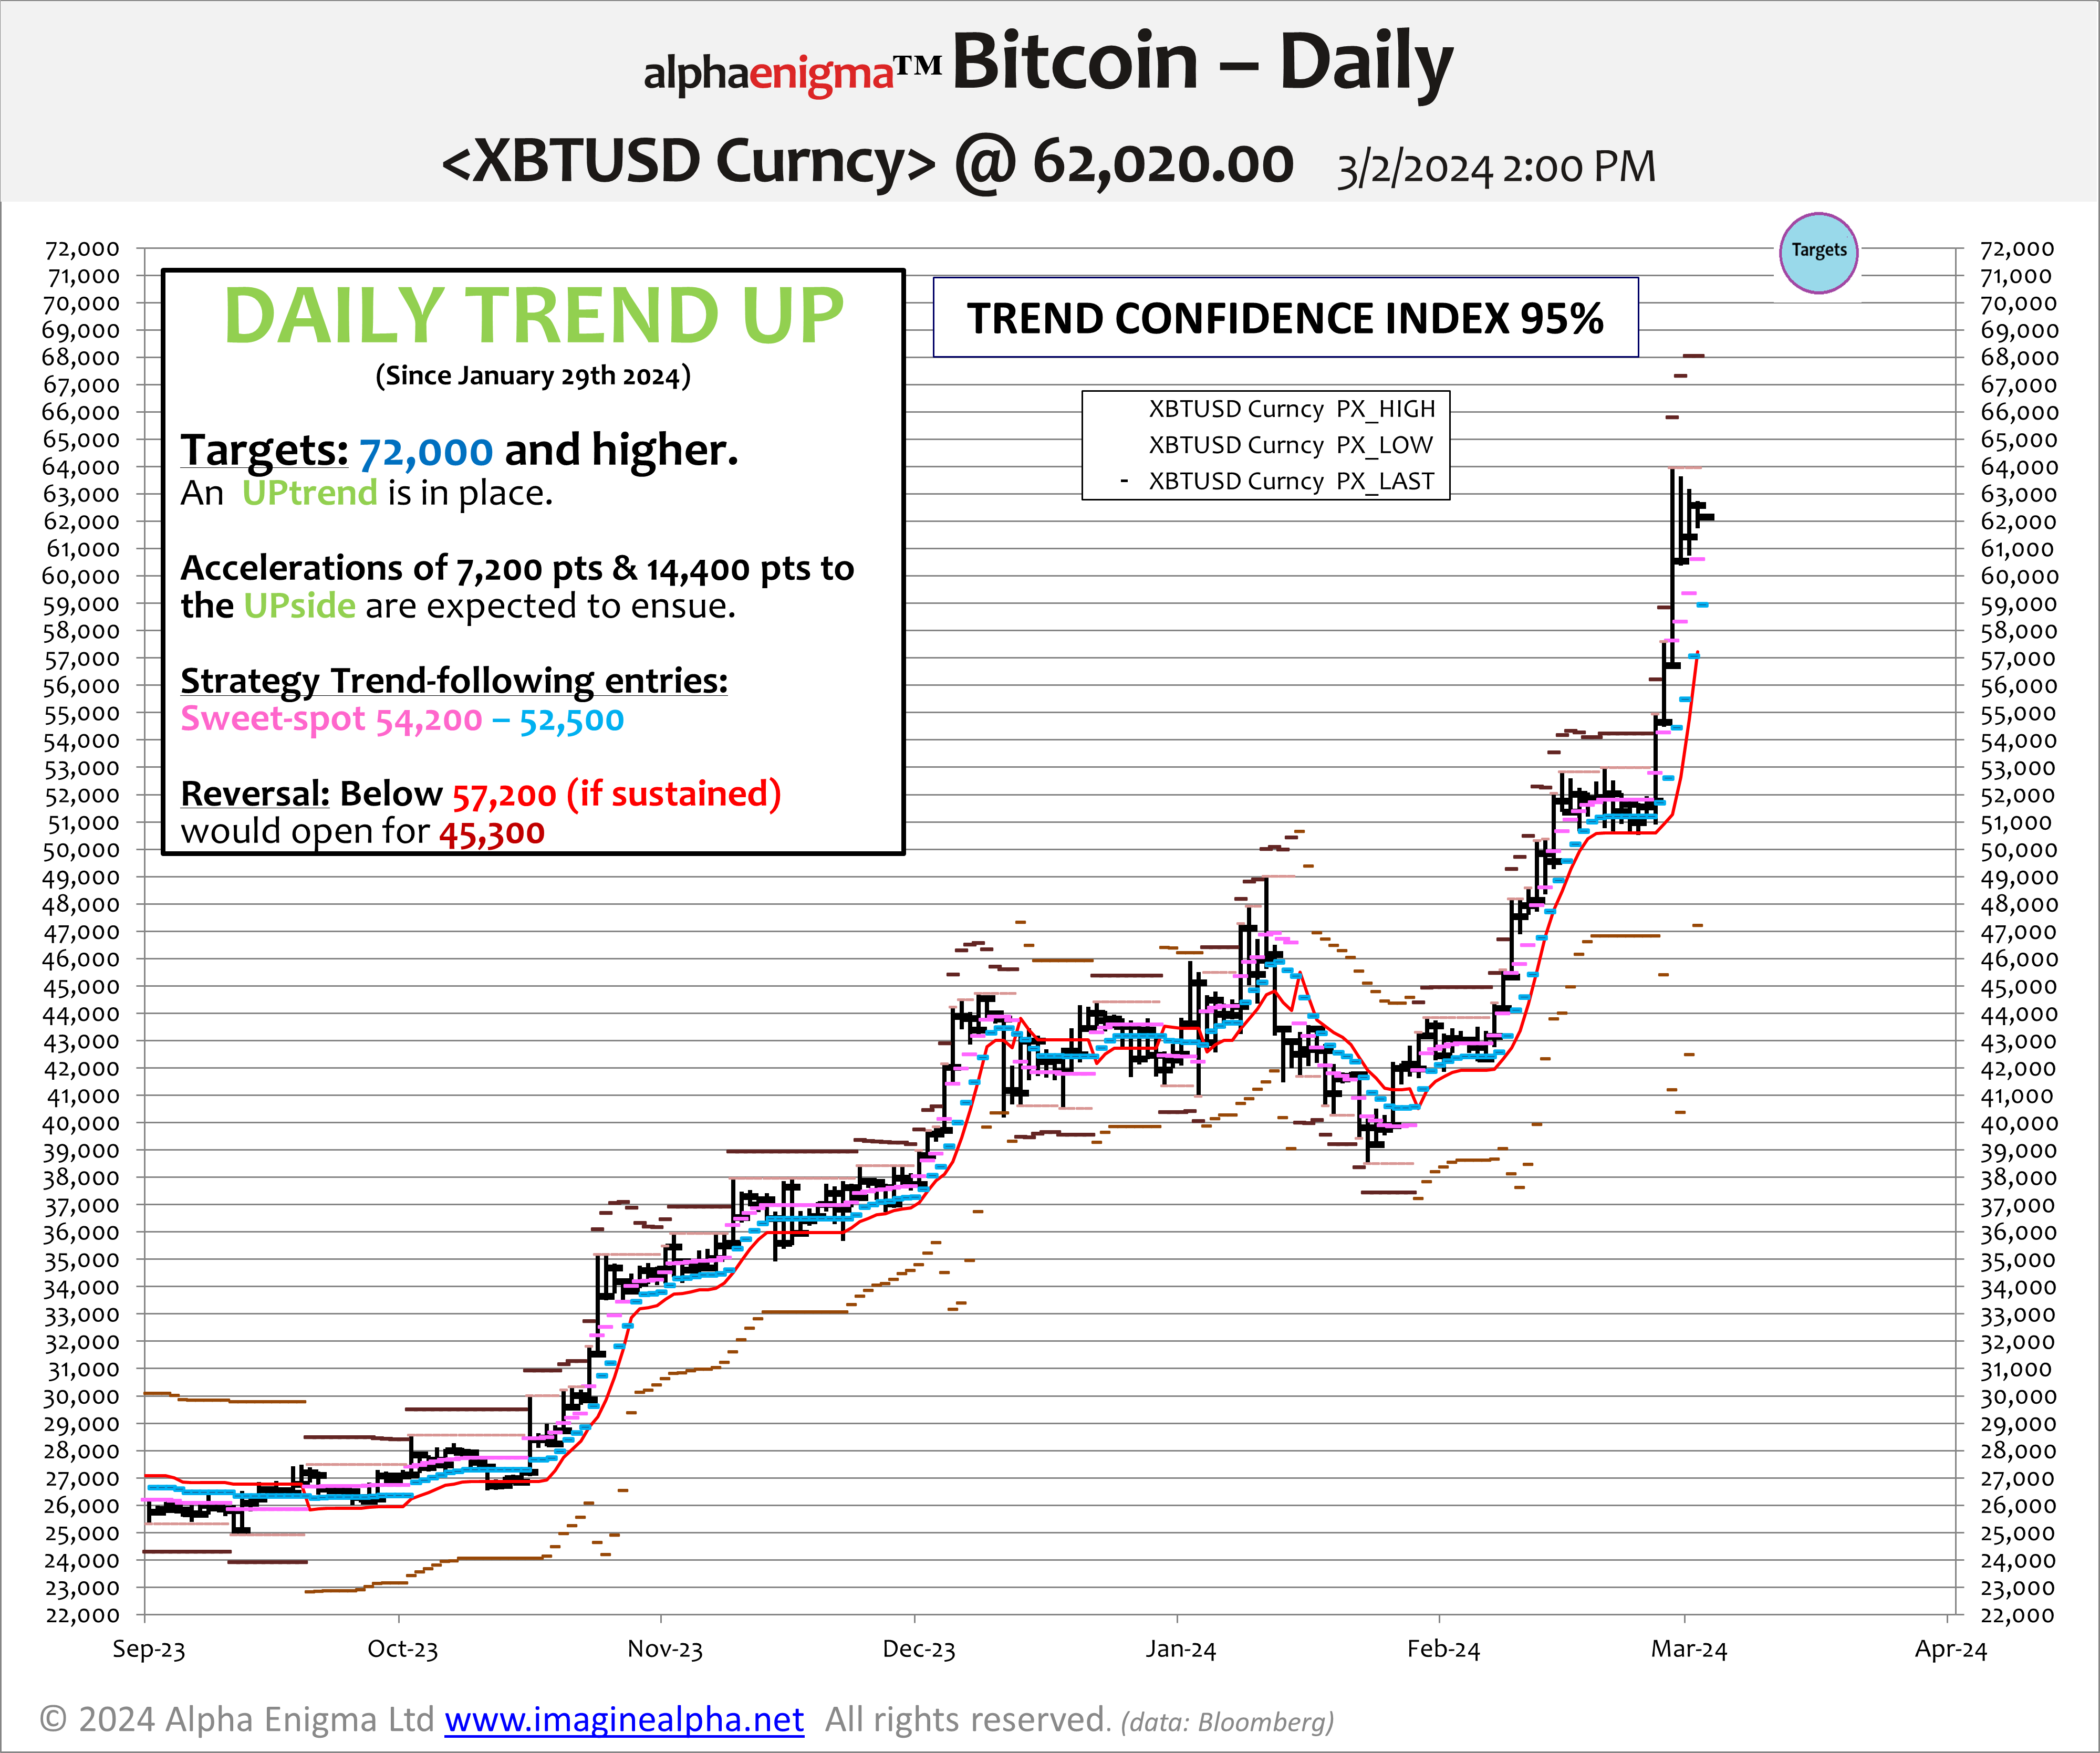
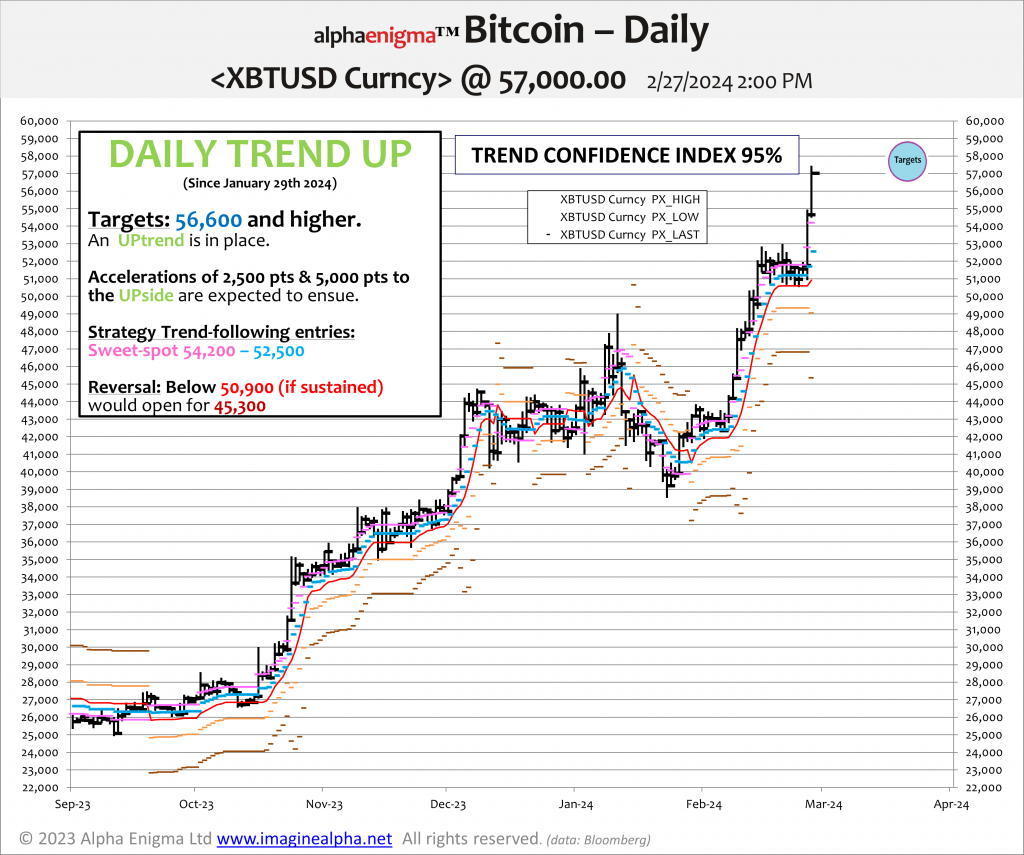
Since January 29th Bitcoin has embarked on an UPtrend that is currently in the midst of its second acceleration. XBT seems to have become unsensitized to the rise of bond yields. Its short term price action has recovered some of its characteristics of 2021 which has important potential repercussions.
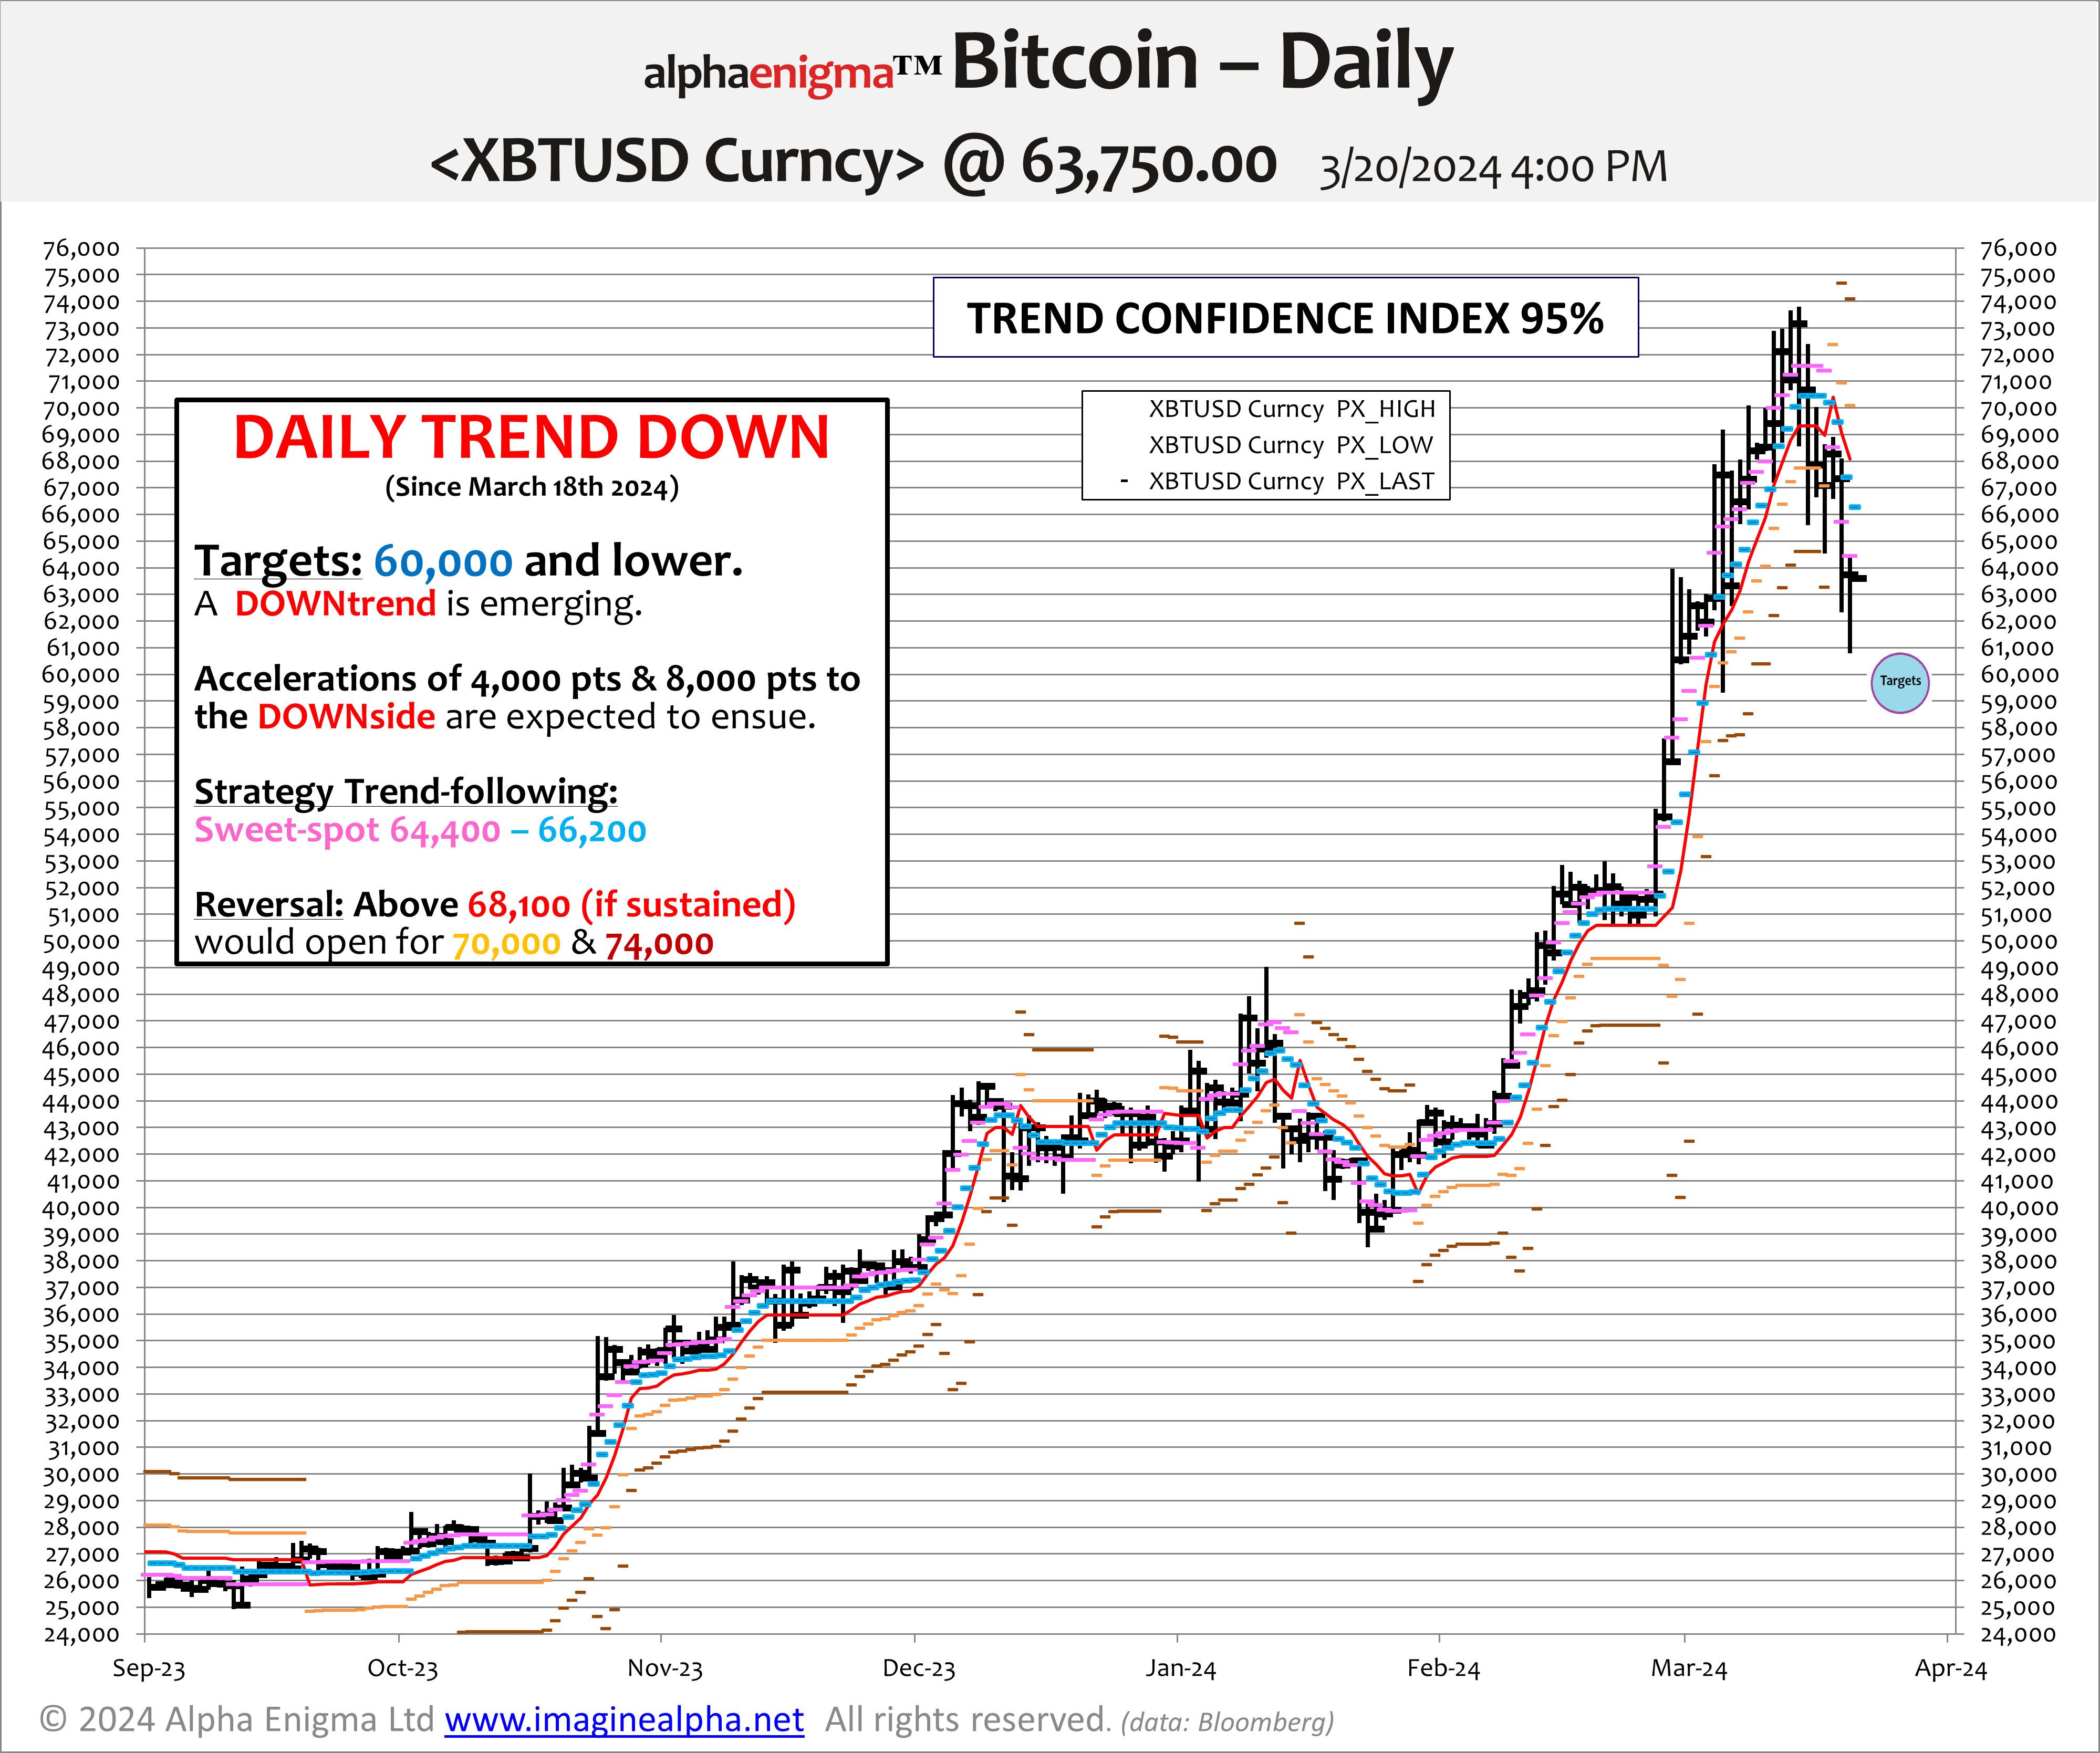
Whilst the $51,000 level holds, it could become the base for sharp spikes/accelerations towards 61,000 and 70,000. The latter is an exhaustion zone for February/March, possibly before the upcoming FOMC on March 20th. At that level extreme bullish sentiment would likely face strong mean reverting forces.
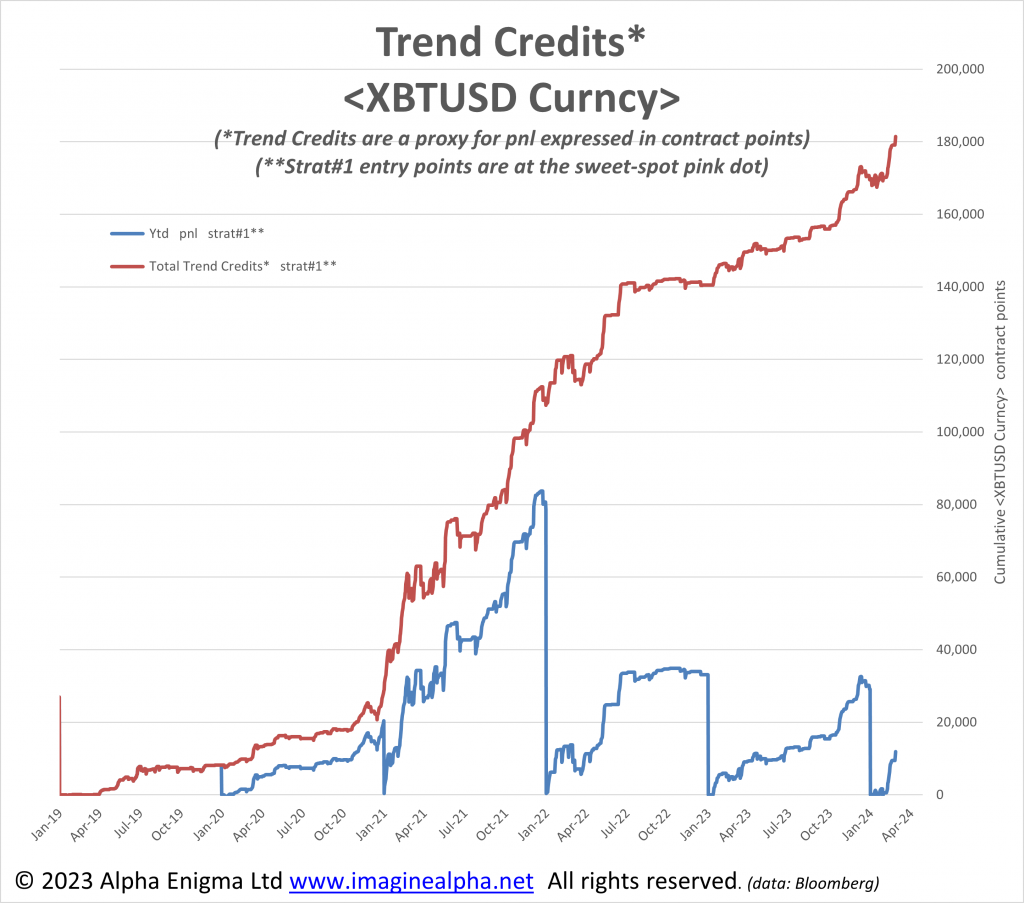
Tactical signals have been “equity accretive” since 2019.
The graph below shows the propensity of XBT to trend, both UP and DOWN. The exhibit below is not a firm back testing exercise, hence the use of the term Trend Credits to account for the accumulated amount of contracts points over the entire lookback window. Nevertheless, following trends around the sweet-spot (pink dot) would enable to limit drawdowns and increase the risk/reward profile.